
El ex Googler Daniel Gilbert le muestra cómo convertir los datos estáticos de AdWords Auction Insights en un informe que rastrea a sus competidores más cercanos a lo largo del tiempo.

Es bueno saber qué está haciendo la competencia. Mientras usted controla sus ofertas, son sus competidores quienes determinan lo que realmente necesita pagar y dónde se colocará su anuncio.
Existen herramientas de terceros que brindan información de la competencia, pero sus datos sobre posición promedio, porcentaje de impresiones, porcentaje de ranking superior, etc., nunca serán tan precisos como los datos reales de AdWords que puede obtener del Informe de estadísticas de subasta. El único problema con este informe es que no es fácil ver los cambios a lo largo del tiempo, que es lo que desea hacer si, por ejemplo, está tratando de comprender los cambios en el costo por clic (CPC) o la posición promedio.
Es irritante que el informe Auction Insights no esté disponible en las secuencias de comandos de AdWords (ni siquiera en la API); si desea hacer algo con él, debe descargarlo de AdWords manualmente. Sin embargo, eso no significa que tengas que hacer todo manualmente. A Brainlabs (mi empleador), usamos un simple Secuencia de comandos de Google Apps que hemos compartido a continuación para convertir los datos en un formato legible y agregar gráficos como los que se muestran a continuación.
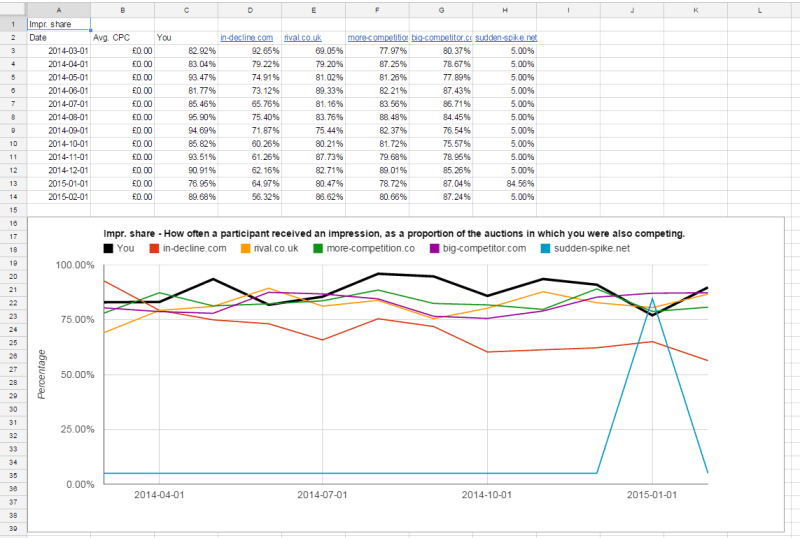
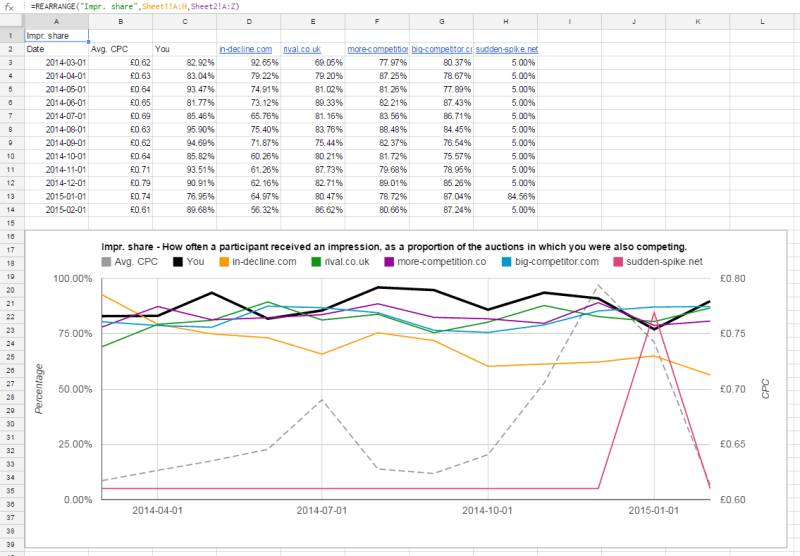
Las secuencias de comandos de Google Apps son bastante similares a las de AdWords. Le permiten automatizar cosas como crear hojas, gráficos y formatear. Nuestro guión a continuación seleccionará a sus cinco competidores principales en función de su porcentaje de impresiones más alto y le mostrará cómo su presencia ha variado con el tiempo (una vez que haya seguido los pasos a continuación).
Nota: Las estadísticas de subasta están disponibles para las campañas de Búsqueda y Shopping, aunque las campañas de Shopping tienen menos columnas. Este script debería funcionar para cualquiera.
Cómo usar el guión
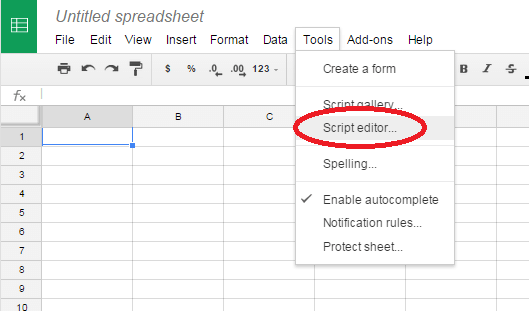
Ir Google Drive, haga clic en el botón rojo «NUEVO» y haga clic en «Hojas de cálculo de Google». Dentro de la nueva hoja de cálculo, haga clic en «Herramientas» en el menú superior y luego en «Editor de secuencias de comandos …»
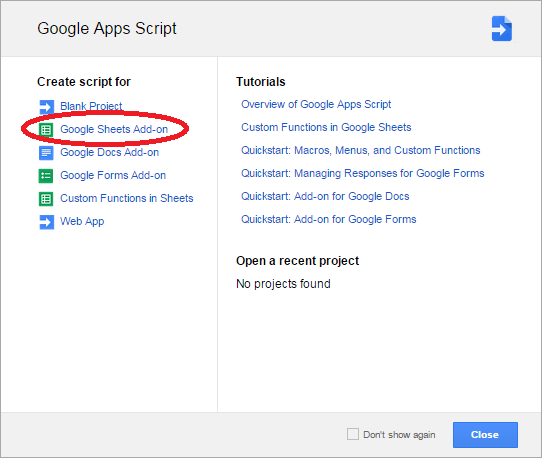
Esto abrirá un editor de scripts en una nueva pestaña. Haga clic en «Complemento de Hojas de cálculo de Google».
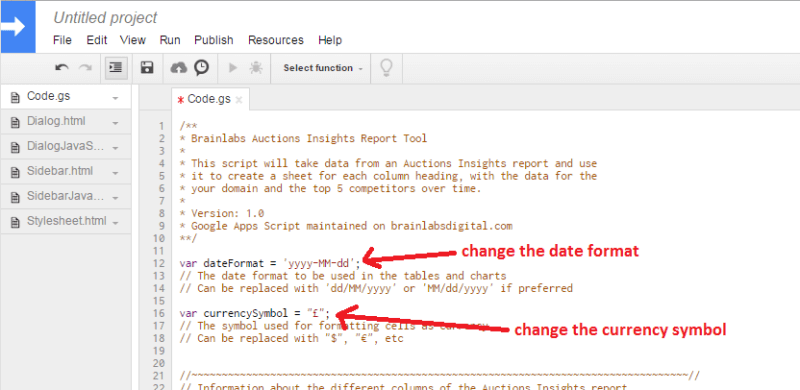
Habrá un código de muestra: elimine todo esto y péguelo en el script que se encuentra al final de este artículo. Puede cambiar un par de configuraciones en la parte superior si lo desea. Hay variables llamadas formato de fecha y símbolo de moneda, que se utilizan para formatear.
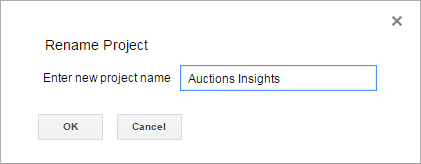
Desde allí, vaya a «Archivo» y guarde el script. Le pedirá un nombre de proyecto, así que llámelo de forma similar a «Estadísticas de subastas». (No importa cómo lo nombre).
En AdWords, obtenga el informe de estadísticas de subasta: vaya a la pestaña de campaña, grupo de anuncios o palabra clave y seleccione las campañas / grupos de anuncios / palabras clave para los que desea el informe. Haga clic en el botón «Detalles» (se encuentra entre «Editar» y «Estrategia de oferta»); luego, en Estadísticas de subasta, haga clic en «Seleccionado».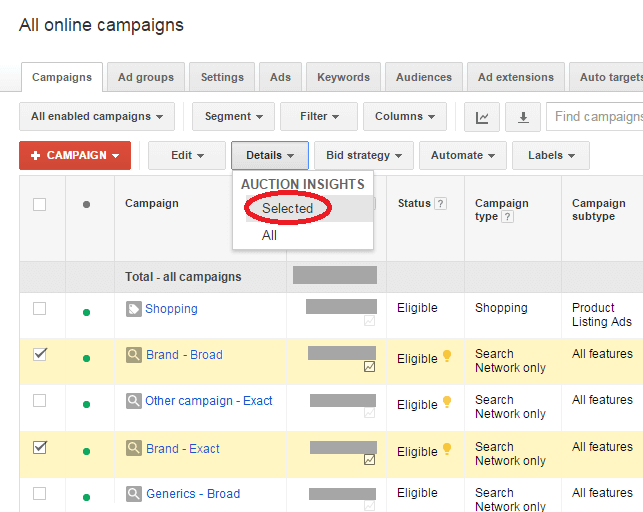
Asegúrese de tener el intervalo de fechas que desea cubrir, luego descargue el informe y agregue un segmento para «Mes» o «Semana» (según la duración del intervalo de tiempo que esté mirando).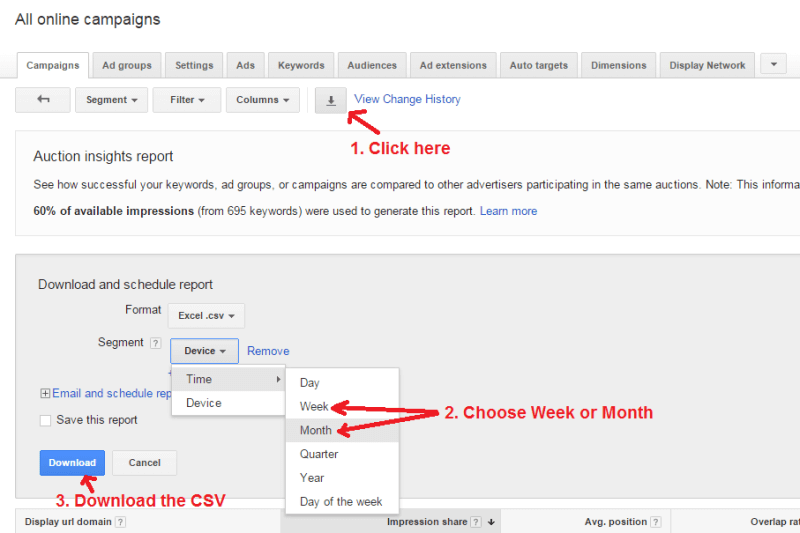
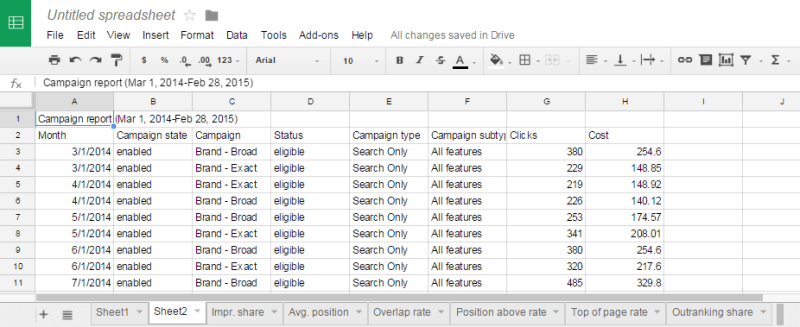
Esto le dará un archivo CSV. Ábralo en un editor de texto (Bloc de notas, por ejemplo), luego cópielo en Sheet1 de su hoja de cálculo de Google. (Sugerimos usar un editor de texto en lugar de Excel porque Excel puede cambiar el formato de las fechas en el informe y luego, cuando se pega en la hoja de cálculo de Google, puede confundirse sobre qué dígito es el día y cuál es el mes).
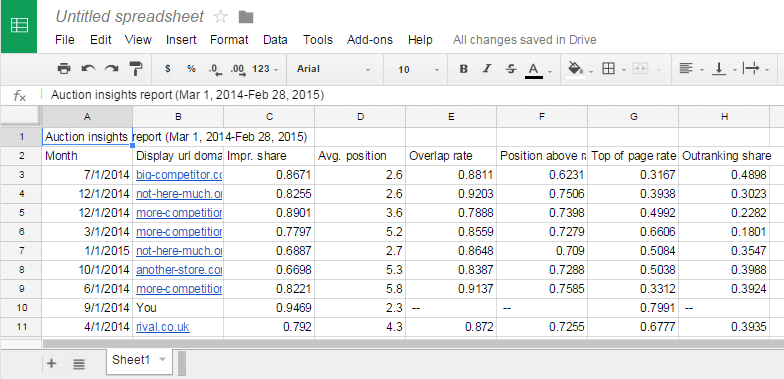
La función onEdit debería activarse automáticamente después de pegar el informe; debería crear una hoja para cada uno de los encabezados de columna del informe y llenarlos con datos y gráficos.
Si desea agregar datos de CPC, agregue otra hoja a la hoja de cálculo (denominada Hoja2) y cópiela en cualquier informe de AdWords que contenga los clics y los costos durante el período (segmentado por mes o semana, igual que el informe de estadísticas de subastas). . No importa si el informe pegado tiene varias campañas / grupos de anuncios / palabras clave: el script sumará todo para cada fecha para calcular el CPC promedio.
La función onEdit se volverá a disparar, actualizando las funciones de REORDEN para que incorporen las CPC. Tener su CPC es útil: puede ver cómo los cambios de su oferta afectaron la subasta o si un nuevo competidor provocó que los clics fueran más costosos.
En la próxima versión, estamos pensando en permitir más flexibilidad para elegir qué competidores incluir. Si puede pensar en otras mejoras, ¡hágamelo saber en los comentarios a continuación!
/**
* Brainlabs Auctions Insights Report Tool
*
* This script will take data from an Auctions Insights report and use
* it to create a sheet for each column heading, with the data for the
* your domain and the top 5 competitors over time.
*
* Version: 1.0
* Google Apps Script maintained on brainlabsdigital.com
**/

var dateFormat="yyyy-MM-dd";
// The date format to be used in the tables and charts
// Can be replaced with 'dd/MM/yyyy' or 'MM/dd/yyyy' if preferred

var currencySymbol = "£";
// The symbol used for formatting cells as currency
// Can be replaced with "$", "€", etc


//~~~~~~~~~~~~~~~~~~~~~~~~~~~~~~~~~~~~~~~~~~~~~~~~~~~~~~~~~~~~~~~~~~~~~~~~~~~~~~~~~~//
// Information about the different columns of the Auctions Insights report

var searchColumns = ["Impr. share", "Avg. position", "Overlap rate", "Position above rate", "Top of page rate", "Outranking share"];
// These are the different columns from the Search Auctions Insight report (in order)

var shoppingColumns = ["Impr. share", "Overlap rate", "Outranking share"];
// The columns for the Shopping campaign Auctions Insight report (in order)

var includeYou = ["Impr. share", "Avg. position", "Top of page rate"];
// These are the columns where there is data for your domain (referred to as "You").

var subtitle = {};
subtitle["Impr. share"] = "How often a participant received an impression, as a proportion of the auctions in which you were also competing.";
subtitle["Avg. position"] = "The average position on the search results page for the participant’s ads when they received an impression.";
subtitle["Overlap rate"] = "How often another participant's ad received an impression when your ad also received an impression.";
subtitle["Position above rate"] = "When you and another participant received an impression in the same auctions, % when participant’s ad was shown in a higher position.";
subtitle["Top of page rate"] = "When a participant’s ads received impressions, how often it appeared at the top of the page above the search results.";
subtitle["Outranking share"] = "How often your ad ranked higher in the auction than another participant's ad, or your ad showed when theirs did not.";


//~~~~~~~~~~~~~~~~~~~~~~~~~~~~~~~~~~~~~~~~~~~~~~~~~~~~~~~~~~~~~~~~~~~~~~~~~~~~~~~~~~//
// The function to create new sheets and charts
function onEdit() {
 // We first check what sort of Auctions Insight report there is
 // as the Shopping report has a different set of column headers
 var title = SpreadsheetApp.getActiveSpreadsheet().getSheetByName("Sheet1").getRange("A1").getValue();
 if (title.substr(0,7) == "Auction") {
 // This means the Auctions Insights report is for Search campaigns
 var columnHeaders = searchColumns;
 } else if (title.substr(0,8) == "Shopping") {
 // The report is for Shopping campaigns
 var columnHeaders = shoppingColumns;
 } else {
 // The title presumably hasn't been copied in yet
 // The columnHeaders array is set to an empty array so the for loop below won't try to run
 var columnHeaders = [];
 }

 // Loop through all the columns
 for (var g=0; g<columnHeaders.length; g++) {

 // We try to go to the sheet for the current column
 var sheet = SpreadsheetApp.getActiveSpreadsheet().getSheetByName(columnHeaders[g]);
 if (sheet == null) {
 // If the sheet doesn't exist, create it
 sheet = SpreadsheetApp.getActiveSpreadsheet().insertSheet(columnHeaders[g]);
 }

 // Because there may not be a Sheet2 yet, or it might not have the CPC information yet, we check
 // whether we should include CPCs or not, and only use a REARRANGE function with Sheet2 if it's there.
 // REARRANGE has three inputs: the column name, the Auctions Insights report and the CPC performance
 // If there is no CPC performance then the third input is set as a single cell
 // The REARRANGE function (see below) will check for this
 if (SpreadsheetApp.getActiveSpreadsheet().getSheetByName("Sheet2") == null ||
 SpreadsheetApp.getActiveSpreadsheet().getSheetByName("Sheet2").getRange("A1").getValue().length == 0) {
 sheet.getRange(1,1).setValue('=REARRANGE("' + columnHeaders[g] + '",Sheet1!A:H,Sheet1!A1)');
 } else {
 if (sheet.getRange(1,1).getFormula() == '=REARRANGE("' + columnHeaders[g] + '",Sheet1!A:H,Sheet1!A1)' &&
 sheet.getCharts().length > 0) {
 // If there is an old chart that didn't include the CPC, remove it so a new one (with the CPC) will be created
 sheet.removeChart(sheet.getCharts()[0]);
 }
 sheet.getRange(1,1).setValue('=REARRANGE("' + columnHeaders[g] + '",Sheet1!A:H,Sheet2!A:Z)');
 }

 // If there aren't any charts then we need to add formatting and charts
 if (sheet.getCharts().length < 1) {

 var numRows = 0;
 var numColumns = 0;

 // These are set to 2 and 1 because the data from REARRANGE starts in cell A2
 var startRow = 2;
 var startColumn = 1;

 // Look at cells to the right of the starting position until a blank one is found,
 // to find the number of columns that contain data
 for (var i=0; i<200; i++) {
 if (sheet.getRange(startRow+i,startColumn).isBlank()) {
 numRows = i;
 break;
 }
 }

 // Find the number of rows that contain data
 for (var i=0; i<30; i++) {
 if (sheet.getRange(startRow,startColumn+i).isBlank()) {
 numColumns = i;
 break;
 }
 }

 // Format the first column (the dates) as dates
 sheet.getRange(startRow+1, startColumn, numRows-1, 1).setNumberFormat(dateFormat);

 // Format the second column (the CPCs) as currency
 sheet.getRange(startRow+1, startColumn+1, numRows-1, 1).setNumberFormat(currencySymbol + "0.00");

 if (columnHeaders[g] == "Avg. position") {
 // If the data is average positions, format it as a number
 sheet.getRange(startRow+1, startColumn+2, numRows-1, numColumns-1).setNumberFormat("0.0");
 } else {
 // Otherwise format it as a percentage
 sheet.getRange(startRow+1, startColumn+2, numRows-1, numColumns-1).setNumberFormat("0.00%");
 }

 // Get the width in pixels for the chart, based on the chart being a few columns wider than the data
 var width = 0;
 for (var i= startColumn; i< startColumn+numColumns+2; i++) {
 width += sheet.getColumnWidth(i);
 }

 // Creates the chart
 var chartBuilder = sheet.newChart()
 .setChartType(Charts.ChartType.LINE)
 .addRange(sheet.getRange(startRow, startColumn, numRows, 1))
 .addRange(sheet.getRange(startRow, startColumn+1, numRows, 1))
 .addRange(sheet.getRange(startRow, startColumn+2, numRows, 1))
 .addRange(sheet.getRange(startRow, startColumn+3, numRows, numColumns-2))
 .setOption('chartArea', {left:'10%',top:'15%',width:'80%',height:'70%'})
 .setPosition(startRow + numRows + 1, startColumn, 0, 0)
 .setOption('width', width)
 .setOption('height', 500)
 .setOption('title', columnHeaders[g] + " - " + subtitle[columnHeaders[g]])
 .setOption('legend', {position: 'top'})
 .setOption('vAxes', {
 // Adds titles to each axis.
 0: {title: 'Percentage'} ,
 1: {title: 'CPC'}
 });


 // Find out if there are any CPCs
 var cpcValues = sheet.getRange(startRow+1, startColumn+1, numRows-1, 1).getValues();
 var thereAreCPCs = false;
 for (var i=0; i<numRows-1; i++) {
 if (cpcValues[i][0] > 0) {
 thereAreCPCs = true;
 break;
 }
 }

 // Find out if there is meant to be data for 'You'
 var thereIsYou = (includeYou.indexOf(columnHeaders[g]) > -1);

 // If the CPCs are all 0, then remove it from the chart (as it isn't useful). Otherwise it
 // is shown as a grey dashed line.

 // If one of the domains is 'You', that will be the second series of data (after the CPC) -
 // this is formatted differently to the competitors to stick out.

 if (thereIsYou && thereAreCPCs) {
 chartBuilder.setOption('series', {
 // The CPC
 0: {targetAxisIndex: 1,
 lineDashStyle: [10,5],
 color: '#999999'},

 // 'You'
 1: {targetAxisIndex: 0,
 color: '#000000',
 lineWidth: 4},

 // Competitors
 2: {targetAxisIndex: 0}
 });

 } else if (thereIsYou && !thereAreCPCs) {
 chartBuilder.removeRange(sheet.getRange(startRow, startColumn+1, numRows, 1));
 chartBuilder.setOption('series', {
 // 'You'
 0: {targetAxisIndex: 0,
 color: '#000000',
 lineWidth: 4},

 // Competitors
 1: {targetAxisIndex: 0},
 2: {targetAxisIndex: 0}
 });

 } else if (!thereIsYou && thereAreCPCs) {
 chartBuilder.setOption('series', {
 // The CPC
 0: {targetAxisIndex: 1,
 lineDashStyle: [10,5],
 color: '#999999'},

 // Competitors
 1: {targetAxisIndex: 0},
 2: {targetAxisIndex: 0}
 });

 } else if (!thereIsYou && !thereAreCPCs) {
 chartBuilder.removeRange(sheet.getRange(startRow, startColumn+1, numRows, 1));
 chartBuilder.setOption('series', {
 // Competitors
 0: {targetAxisIndex: 0},
 1: {targetAxisIndex: 0},
 2: {targetAxisIndex: 0}
 });
 }

 // Creates the specified chart and inserts it into the sheet
 var chart = chartBuilder.build();
 sheet.insertChart(chart);
 }

 }
} //end function onEdit


//~~~~~~~~~~~~~~~~~~~~~~~~~~~~~~~~~~~~~~~~~~~~~~~~~~~~~~~~~~~~~~~~~~~~~~~~~~~~~~~~~~//
// The function to create new sheets and charts
function REARRANGE(columnHeader,auditInsights,performance) {

 // Dates are stored as bigendian date strings, then converted back to dates at the end
 var bigendianDate="yyyy-MM-dd";
 // The timezone is used to convert them back
 var timezone = SpreadsheetApp.getActiveSpreadsheet().getSpreadsheetTimeZone();

 var domains = {};
 var dates = [];
 var domainNames = [];


 // First we record the stats for each domain, by month
 // and record each domain's highest impression share
 for (var i = 2; i<auditInsights.length; i++) {
 // auditInsights is a multi-dimensional array containing the values of the auditInsights cells.
 // So auditInsights[i] is a row on the Auction Insights report
 // The loop starts at 2 as auditInsights[0] is the title and auditInsights[1] is the headers.

 var date = auditInsights[i][0];

 if (!date) {
 // If the date field is blank, we have reached the end of the data
 // so we end the for loop
 break;
 }

 if (typeof date != "string") {
 // The date is converted into a string
 date = Utilities.formatDate(date, timezone, bigendianDate);
 }

 if (dates.indexOf(date) < 0) {
 // If the current row's date isn't in the dates array, it's added
 dates.push(date);
 }

 var imprShare = auditInsights[i][2]; //the impression share
 if (imprShare == "< 10%") {
 // If the impression share is "< 10%" (a string) it is changed to 5% (a float)
 // so it can be displayed in the graph.
 imprShare = 0.05;
 }

 var domainName = auditInsights[i][1];

 if (domainNames.indexOf(domainName) < 0) {
 // If the current row's domain name isn't in the domainNames array, it is added,
 // and an entry for it is entered into the domains object.
 domainNames.push(domainName);
 domains[domainName] = [];
 domains[domainName]["Max Impr Share"] = imprShare;
 }

 domains[domainName][date] = [imprShare].concat(auditInsights[i].slice(3));
 // This is (in order) the impression share, avg. position, overlap rate, position above rate, top of page rate, outranking share

 if (imprShare > domains[domainName]["Max Impr Share"]) {
 // If the current imprShare is bigger than the last recorded max impr share,
 // the current one is recorded as being the max
 domains[domainName]["Max Impr Share"] = imprShare;
 }

 } // end of for loop


 // Next we get the costs and clicks from Sheet2 (if it exists), to get the CPC
 // If Sheet2 exists, performance will be a multidimensional array. If it doesn't it will only contain 1 cell.
 var hasCPC = (performance.length > 1);
 var costTotals = [];
 var clicksTotals = [];

 if (hasCPC) {
 // Dates should be in the first column, but the position of the cost and clicks columns varies depending on AdWords settings
 // So we set variables to record the required column numbers
 var costIndex = performance[1].indexOf("Cost");
 var clicksIndex = performance[1].indexOf("Clicks");

 for (var i = 2; i<performance.length; i++) {
 var date = performance[i][0];

 if (!date) {
 // If there's no date we've reached the end of the data
 break;
 }

 if (typeof date != "string") {
 // If the date isn't a string, convert it into one
 date = Utilities.formatDate(date, timezone, bigendianDate);
 }

 if (costTotals[date] == undefined) {
 costTotals[date] = performance[i][costIndex];
 clicksTotals[date] = performance[i][clicksIndex];
 } else {
 costTotals[date] += performance[i][costIndex];
 clicksTotals[date] += performance[i][clicksIndex];
 }

 } // end of for loop
 }

 dates.sort();
 // Sorts the dates alphabetically - as they're in bigendian format, this means they are sorted oldest to newest

 domainNames.sort(compareDomainNames);
 // Sorts the domain names by their highest impression share, using the function below

 function compareDomainNames(a,b) {
 if (domains[a]["Max Impr Share"] != domains[b]["Max Impr Share"]) {
 // If the max impression shares are different, the domain with the highest is put first
 return domains[b]["Max Impr Share"] - domains[a]["Max Impr Share"];
 } else {
 // If both domains have the same max impression share, the one with data for the most dates is put first
 return Object.keys(domains[b]).length - Object.keys(domains[a]).length;
 }
 }

 domainNames.splice(domainNames.indexOf("You"),1);
 // Removes "You" from the array

 if (includeYou.indexOf(columnHeader) > -1) {
 // If this graph is supposed to include 'You', then it's added to the start of the array
 domainNames.unshift("You");
 }

 var g = auditInsights[1].indexOf(columnHeader)-2;
 // The index of the required stat

 if (g < 0) {
 // Error checking - if the columnHeader wasn't a recognised title, we output an error message
 return [[columnHeader + " not recognised."]];
 }

 // 'output' is a multi-dimensional array that will become cells in the spreadsheet
 output = [];

 // The first row of the output is the column name
 output[0] = [columnHeader];

 // The second row of the output is the headings
 output[1] = ["Date","Avg. CPC"];
 for (var d = 0; d<domainNames.length && d<6; d++) {
 output[1].push(domainNames[d]);
 }

 // We loop though the dates to make their lines of output
 // (the date, the CPC, then each domain's metric)
 for (var i = 0; i<dates.length; i++) {
 output[i+2] = [stringToDate(dates[i])];

 // Calculate the average CPC
 if (costTotals[dates[i]] == undefined || clicksTotals[dates[i]] == undefined || clicksTotals[dates[i]] == 0) {
 output[i+2].push(0);
 } else {
 output[i+2].push(costTotals[dates[i]]/clicksTotals[dates[i]]);
 }

 for (var d = 0; d<domainNames.length && d<6; d++) {
 if (domains[domainNames[d]][dates[i]] === undefined) {
 output[i+2].push(0);
 } else {
 output[i+2].push(domains[domainNames[d]][dates[i]][g]);
 }
 }
 }

 return output;

}// end function REARRANGE


//~~~~~~~~~~~~~~~~~~~~~~~~~~~~~~~~~~~~~~~~~~~~~~~~~~~~~~~~~~~~~~~~~~~~~~~~~~~~~~~~~~//
// This function is used by REARRANGE to convert date-strings back into dates
function stringToDate(string) {
 var dateBits = string.split("-");

 var date = new Date();
 date.setFullYear(dateBits[0]);
 date.setMonth(parseInt(dateBits[1],10)-1);
 date.setDate(parseInt(dateBits[2],10));

 return date;
}
Actualizar: Editado para corregir un error en el código.
Las opiniones expresadas en este artículo pertenecen al autor invitado y no necesariamente a El Blog informatico. Los autores del personal se enumeran aquí.